You can now adjust your axis scale on charts within the results summary
We've released an update allowing you to adjust the minimum and maximum values on the chart axis scale, as well as switch between percentage and value.
This enables you to adjust the scale to visualise the data fully within the chart, removing unused space and making charts clearer.
New Chart Setting
You can edit the axis scale from the chart settings within the "Display Options" tab.

Example chart where maxmium percentage is 25.68%

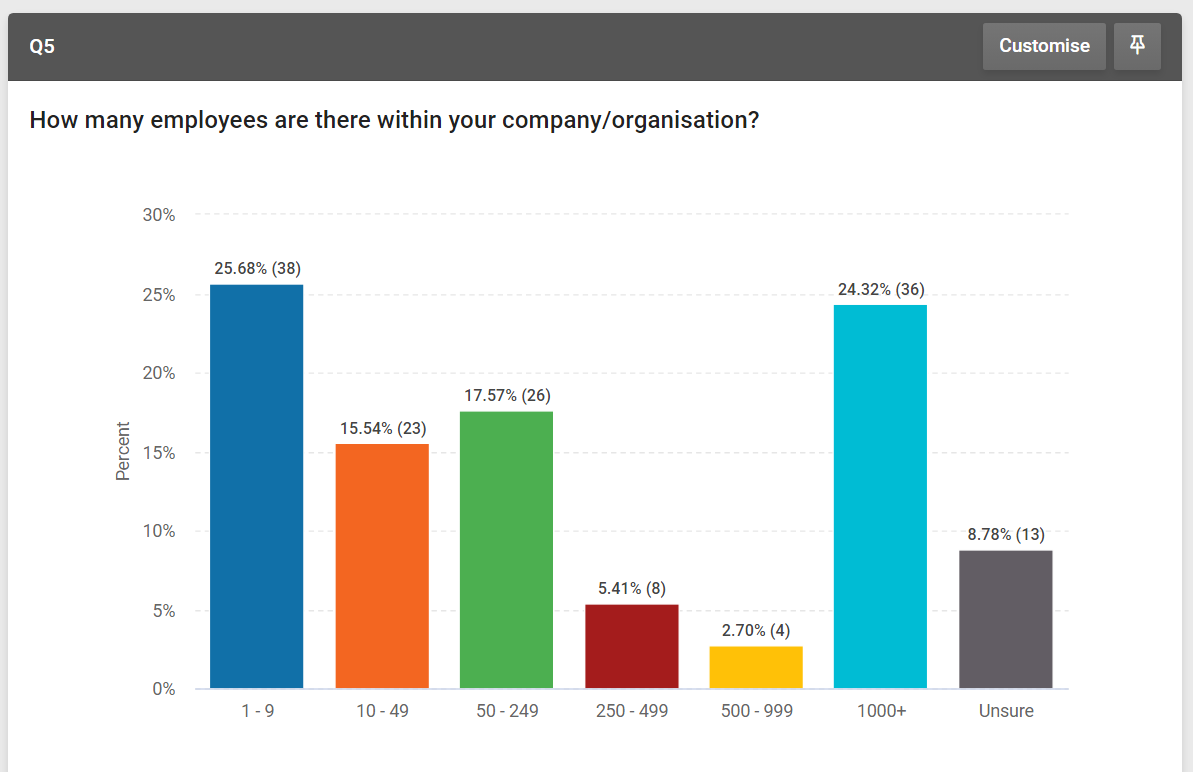
Example chart where maximum percentage is 25.68% and axis adjusted to maximum of 30%
Links
- Helpguides - Results Summary & Options
Get started and create your first survey
If you would like more information then please get in touch.
SmartSurvey is a digital survey solution that helps anyone create surveys, build questionnaires and analyse the results.


