Turn Survey Data Into Actionable Insights With Dashboards And Sentiment Analysis
While we all strive to improve our survey response rate, converting them into actionable data is another uphill battle altogether, especially when you do not have the right tools and are stuck doing them manually.
That’s where our new Dashboards feature comes in. Bridging the gap between information and action, Dashboards lets you extract meaningful trends and uncover hidden info which can be otherwise time-consuming. The new Sentiment Analysis feature further enhances the reporting capabilities in SmartSurvey, automatically tagging text responses as Positive, Negative, and Neutral, enabling you to proactively address concerns and prevent bad experiences.
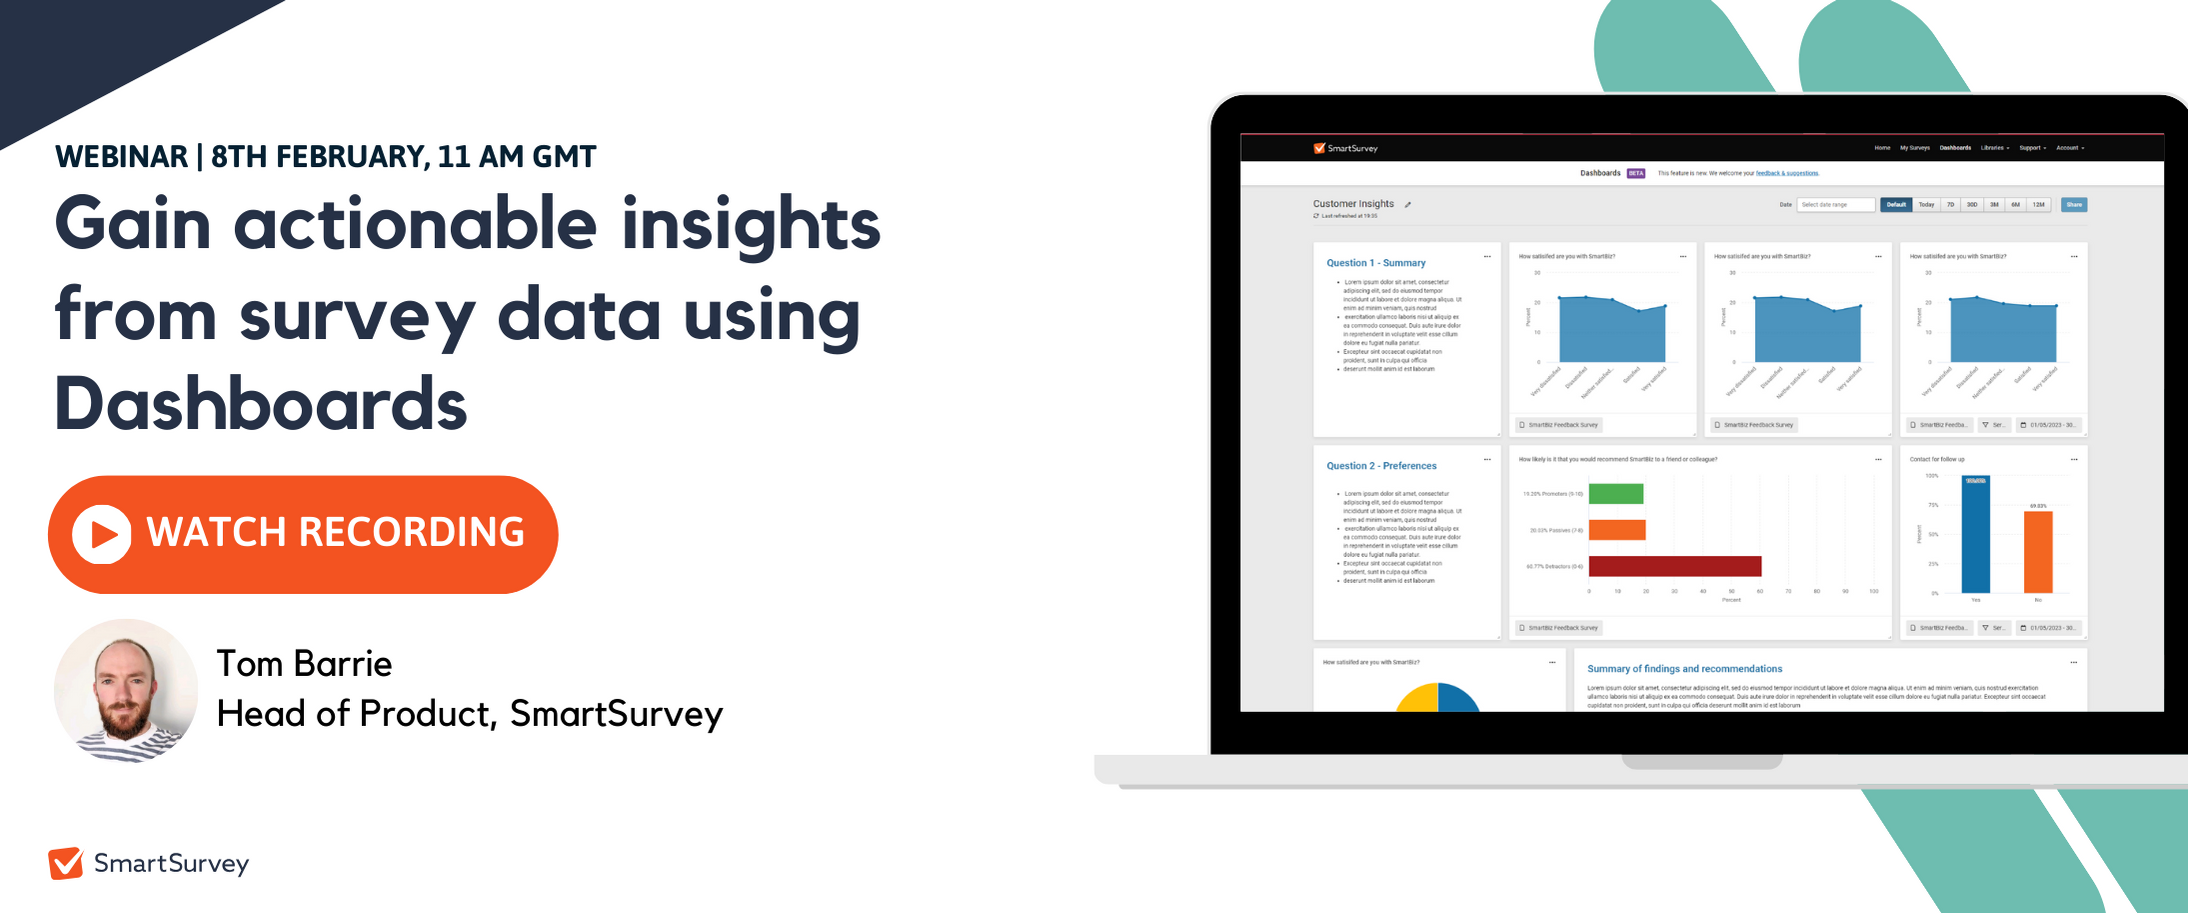
Would you like to see it in action? Check out our product webinar recording:
In this blog, we’ll show you how Dashboards and Sentiment Analysis can unlock the true potential of your survey data and empower you to make data-driven decisions with confidence.
Before diving in further, let’s understand what insights are.
Revisiting the fundamentals: What are insights?
An insight is a meaningful interpretation derived from your survey responses. It could be a recurring pattern, a contrasting sentiment, or an interesting correlation between questions. These insights help you understand your audience, pinpoint areas for improvement, and ultimately guide your strategy.
SmartSurvey empowers you to analyse your data in real-time, eliminating the need to wait until the survey closes. You can segment, compare, and monitor responses as they come in, giving you a head start on identifying trends and taking action.
But what if you could effortlessly visualise and compare all this insightful data in one place? That's where Dashboards come in.
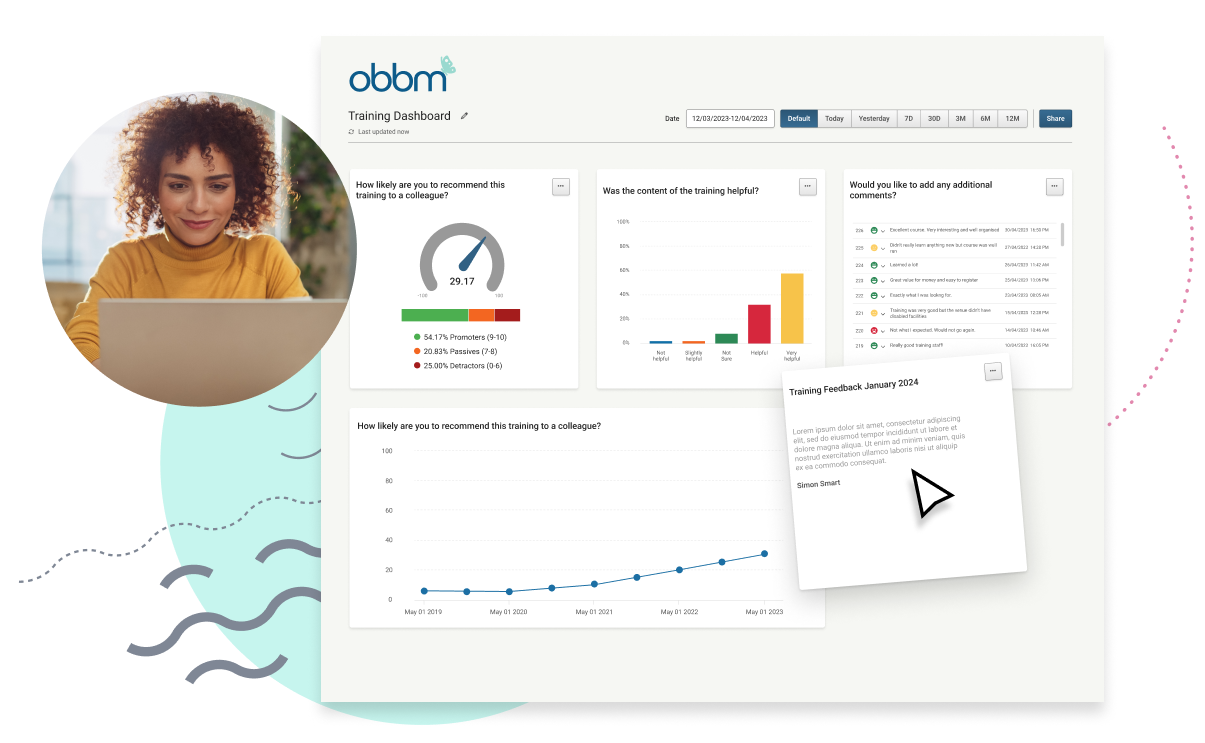
Introducing Dashboards:
Dashboards in SmartSurvey is a central hub where you can bring your survey data to life. It allows you to:
- Pin data from any survey within your account to one central location

- Utilise existing filters to segment and compare data across different groups and cohorts
- Tailor your dashboard layout with fully resizable tiles for optimal data visualisation

- Monitor key metrics in real-time, including NPS, customer effort score (CES) and CSAT.

- Share dashboards internally with team members, fostering data-driven communication
- Generate public links for external stakeholders, keeping them informed with branded, white-labeled reports
Get the gist instantly with Sentiment Analysis
Open-ended questions offer a treasure trove of valuable information, but manually analysing them can be daunting. With Sentiment Analysis, SmartSurvey automatically categorises responses as positive, negative, or neutral, giving you a quick overview of the emotional undercurrent.
But it doesn't stop there. You can:
- Drill down into specific sentiments to understand the "why" behind positive or negative feedback
- Track sentiment changes over time to identify emerging trends and areas needing attention
- Take immediate action by addressing negative feedback promptly, closing the loop with your customers
Ready to transform your data analysis?
SmartSurvey Dashboards offer a revolutionary way to unlock the true potential of your survey data. By seamlessly bringing data visualisation, collaboration, and sentiment analysis together, you can gain actionable insights faster, make data-driven decisions with confidence, and ultimately transform your business.
Are you ready to take your data analysis to the next level? Try Dashboards today and see how they can empower you to turn insights into action!
Get started and create your first survey


